1.I.5I
According to the Independent newspaper (London, 8 March 1994) the Metropolitan Police in London reported 30475 people as missing in the year ending March 1993. For those aged 18 or less, 96 of 10527 missing males and 146 of 11363 missing females were still missing a year later. For those aged 19 and above, the values were 157 of 5065 males and 159 of 3520 females. This data is summarised in the table below.
\begin{array}{rrrrr} & \multicolumn{3}{r}{\text { age }} \\ 1 & \text { Kender } & \text { M } & 96 & 10527 \\ 2 & \text { Kid } & \text { F } & 146 & 11363 \\ 3 & \text { Adult } & \text { M } & 157 & 5065 \\ 4 & \text { Adult } & \text { F } & 159 & 3520 \end{array}
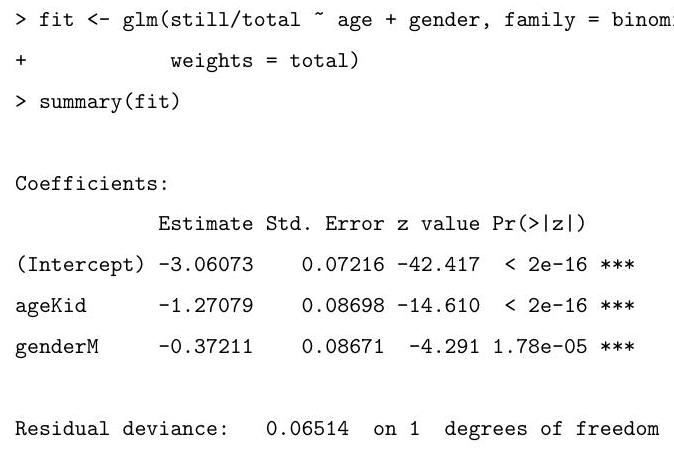
Explain and interpret the commands and (slightly abbreviated) output below. You should describe the model being fitted, explain how the standard errors are calculated, and comment on the hypothesis tests being described in the summary. In particular, what is the worst of the four categories for the probability of remaining missing a year later?

For a person who was missing in the year ending in March 1993, find a formula, as a function of age and gender, for the estimated expected probability that they are still missing a year later.