Paper 4, Section I,
Sulphur dioxide is one of the major air pollutants. A dataset by Sokal and Rohlf (1981) was collected on 41 US cities/regions in 1969-1971. The annual measurements obtained for each region include (average) sulphur dioxide content, temperature, number of manufacturing enterprises employing more than 20 workers, population size in thousands, wind speed, precipitation, and the number of days with precipitation. The data are displayed in as follows (abbreviated):

Describe the model being fitted by the following commands.
fit temp manuf pop wind precip days
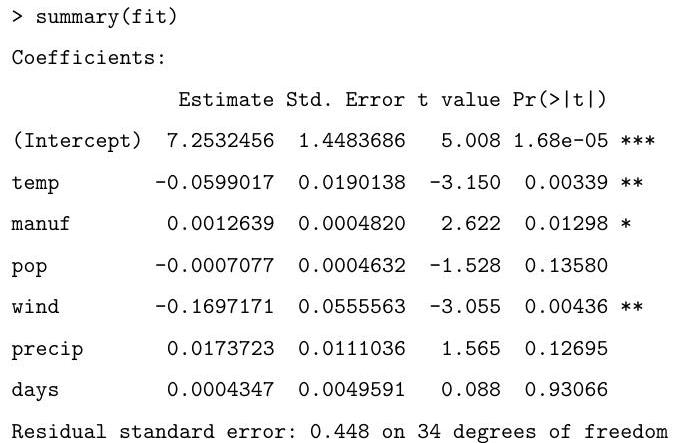
Explain the (slightly abbreviated) output below, describing in particular how the hypothesis tests are performed and your conclusions based on their results:

Based on the summary above, suggest an alternative model.
Finally, what is the value obtained by the following command?