Paper 1, Section II, J
The data consist of the record times in 1984 for 35 Scottish hill races. The columns list the record time in minutes, the distance in miles, and the total height gained during the route. The data are displayed in as follows (abbreviated):
Consider a simple linear regression of time on dist and climb. Write down this model mathematically, and explain any assumptions that you make. How would you instruct to fit this model and assign it to a variable hills. ?
First, we test the hypothesis of no linear relationship to the variables dist and climb against the full model. provides the following ANOVA summary:

Using the information in this table, explain carefully how you would test this hypothesis. What do you conclude?
The command
summary (hills. Im1)
provides the following (slightly abbreviated) summary:

Carefully explain the information that appears in each column of the table. What are your conclusions? In particular, how would you test for the significance of the variable climb in this model?

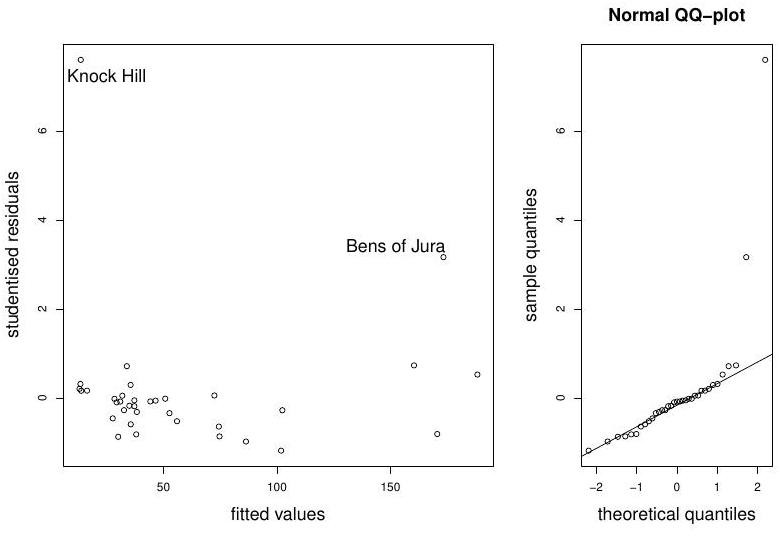
Figure 1: Hills data: diagnostic plots
Finally, we perform model diagnostics on the full model, by looking at studentised residuals versus fitted values, and the normal QQ-plot. The plots are displayed in Figure Comment on possible sources of model misspecification. Is it possible that the problem lies with the data? If so, what do you suggest?