Paper 3, Section I,
In an experiment to study factors affecting the production of the plastic polyvinyl chloride , three experimenters each used eight devices to produce the PVC and measured the sizes of the particles produced. For each of the 24 combinations of device and experimenter, two size measurements were obtained.
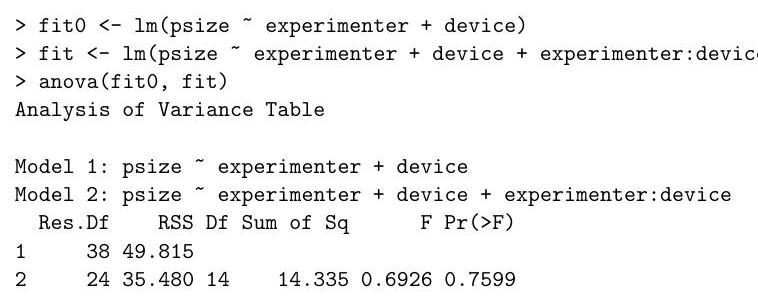
The experimenters and devices used for each of the 48 measurements are stored in as factors in the objects experimenter and device respectively, with the measurements themselves stored in the vector psize. The following analysis was performed in .

Let and denote the design matrices obtained by model.matrix(fit) and model.matrix (fit0) respectively, and let denote the response psize. Let and denote orthogonal projections onto the column spaces of and respectively.
For each of the following quantities, write down their numerical values if they appear in the analysis of variance table above; otherwise write 'unknown'.
Out of the two models that have been fitted, which appears to be the more appropriate for the data according to the analysis performed, and why?