In a study on infant respiratory disease, data are collected on a sample of 2074 infants. The information collected includes whether or not each infant developed a respiratory disease in the first year of their life; the gender of each infant; and details on how they were fed as one of three categories (breast-fed, bottle-fed and supplement). The data are tabulated in R as follows:
123456 disease 771947481631 nondisease 381128447336111433 gender Boy Boy Boy Girl Girl Girl food Bottle-fed Supplement Breast-fed Bottle-fed Supplement Breast-fed
Write down the model being fit by the R commands on the following page:

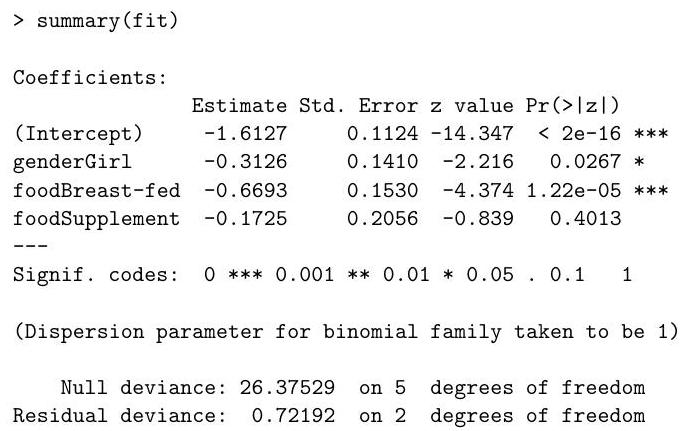
The following (slightly abbreviated) output from R is obtained.

Briefly explain the justification for the standard errors presented in the output above.
Explain the relevance of the output of the following R code to the data being studied, justifying your answer:
>exp(c(−0.6693−1.96∗0.153,−0.6693+1.96∗0.153))
[1] 0.37939400.6911351
[Hint: It may help to recall that if Z∼N(0,1) then P(Z⩾1.96)=0.025.]
Let D1 be the deviance of the model fitted by the following R command.
> fit 1<− glm (disease/total gender + food + gender:food,
+ family = binomial, weights = total )
What is the numerical value of D1 ? Which of the two models that have been fitted should you prefer, and why?

