The data frame Cases. of .flu contains a list of cases of flu recorded in 3 London hospitals during each month of 2017 . Consider the following R code and its output.
table (Cases. of.flu)
Month Hospital
Month April A 10 B 40 C 27
April August 10940342719
August December 924341291981
December February 24491291348174
February January 49451341387478
July 511138367835
June 113622
March 208241
May 54323
November 178262
October 62619
September 64021
Cases. of.flu.table = as.data.frame (table (Cases. of .flu))
> head (Cases. of .flu.table)
Month Hospital Freq
1 April A 10
2 August A 9
3 December A 24
4 February A 49
5 January A 45
6 July A 5
>mod1= glm (Freq ., data=Cases. of .flu.table, family=poisson)
>mod1$dev
[1] 28.51836
levels (Cases. of.flu$Month)

Describe a test for the null hypothesis of independence between the variables Month and Hospital using the deviance statistic. State the assumptions of the test.
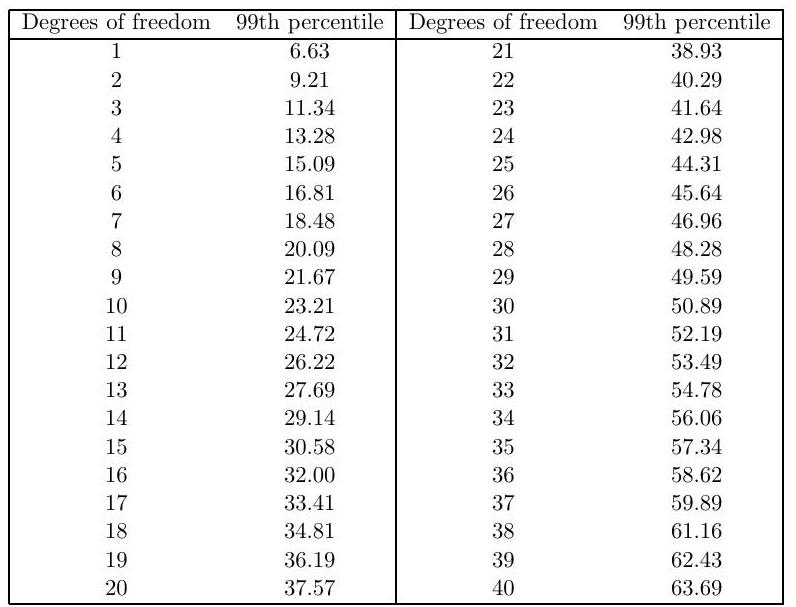
Perform the test at the 1% level for each of the two different models shown above. You may use the table below showing 99 th percentiles of the χp2 distribution with a range of degrees of freedom p. How would you explain the discrepancy between their conclusions?


